Data Analyst Career Path 2026: Skills, Roadmap, Projects, and Job Strategy
The complete 2026 guide to becoming a data analyst: essential skills (SQL, Power BI, Excel, Python), portfolio projects, interview preparation, salary expectations, and career progression from junior analyst to leadership roles.

Data Analyst Career Path 2026: Skills, Roadmap, Projects, and Job Strategy
Data analysts turn raw data into actionable business insights, making them indispensable across industries from finance and healthcare to e-commerce and manufacturing. In 2026, the role demands technical proficiency, business understanding, and storytelling skills that bridge data teams and decision-makers.
This guide covers the complete career path: what data analysts do daily, the skills that get you hired, portfolio projects that stand out, interview strategies, salary expectations, and how to progress from junior analyst to senior leadership roles.

What Data Analysts Do Daily
Data analysts spend their days gathering requirements from business stakeholders, extracting and cleaning data using SQL and Python, building dashboards in Power BI or Tableau, creating reports with Excel or Google Sheets, and presenting insights through clear visualizations and narratives.
The role splits roughly 40% data preparation and analysis, 30% visualization and dashboarding, 20% stakeholder communication, and 10% learning new tools and methodologies to solve emerging business problems.
Core Technical Skills (Must-Have for 2026)
Every data analyst job posting in 2026 lists these foundational skills. Master them first before exploring advanced topics.
SQL (80% of job postings)
- SELECT, JOINs, GROUP BY, HAVING, subqueries, CTEs, window functions (ROW_NUMBER, RANK, LAG/LEAD)
- Aggregations (SUM, COUNT, AVG) with filtering and conditional logic (CASE WHEN)
- Practice 50-100 real-world queries on platforms like StrataScratch, LeetCode, or HackerRank
Excel/Google Sheets (70% of job postings)
- Pivot tables, VLOOKUP/XLOOKUP, INDEX/MATCH, dynamic arrays (FILTER, SORT, UNIQUE)
- Advanced formulas (SUMIFS, COUNTIFS, TEXT functions, DATE calculations)
- Charts, conditional formatting, data validation for stakeholder-ready deliverables
Power BI/Tableau (65% of job postings)
- Data modeling (star schema, relationships, DAX measures), semantic models
- Interactive dashboards with slicers, drill-through, bookmarks, conditional formatting
- Performance optimization, data refresh strategies, Power BI Service publishing
6-Month Learning Roadmap
Months 1-2: Foundation (20 hrs/week)
- SQL: Master 50 queries (joins, aggregations, window functions)
- Excel: Pivot tables, VLOOKUP, charts, dynamic formulas
- Power BI: Import data, basic visuals, simple DAX (SUM, COUNT, CALCULATE)
Months 3-4: Intermediate (15 hrs/week)
- Advanced SQL: CTEs, subqueries, complex analytics
- Power BI: Star schema modeling, time intelligence DAX, interactive dashboards
- Build 3 portfolio projects (sales dashboard, customer analysis, finance report)
Months 5-6: Job Ready (10 hrs/week)
- 5 advanced portfolio projects (executive dashboard, churn analysis, geospatial)
- Mock interviews (SQL live coding, case studies, behavioral questions)
- LinkedIn optimization, networking, 50 targeted applications
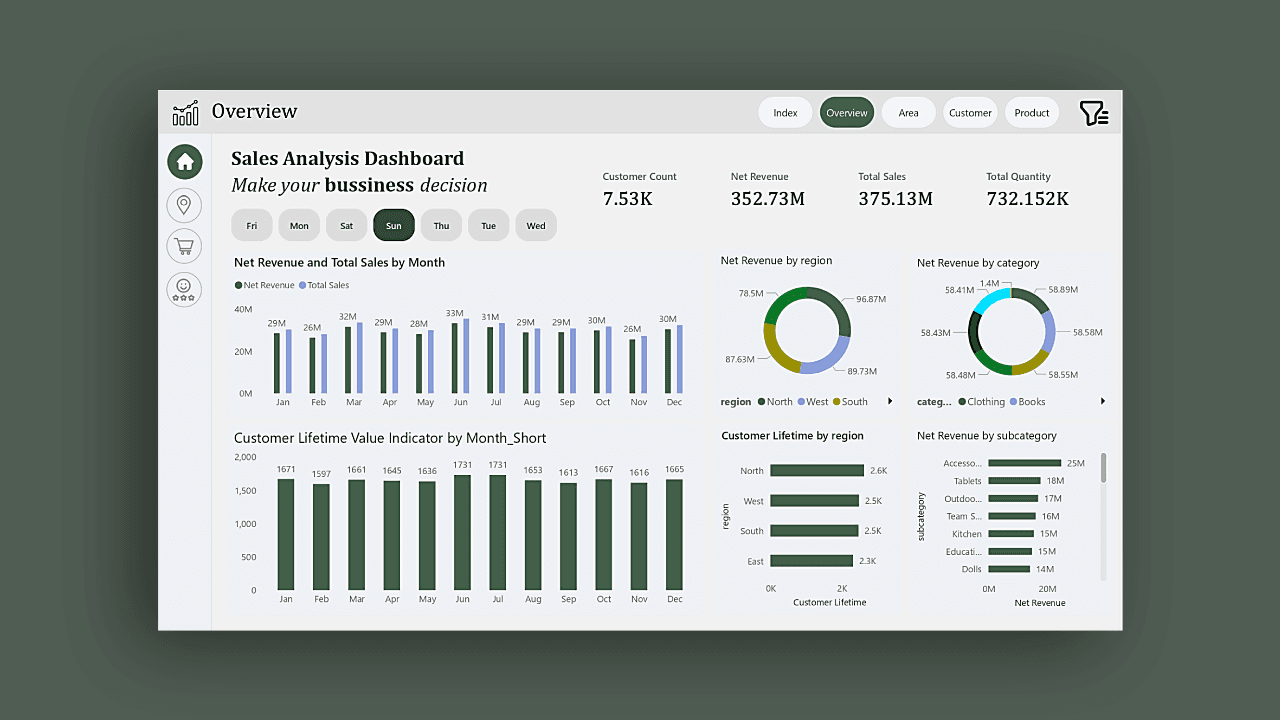
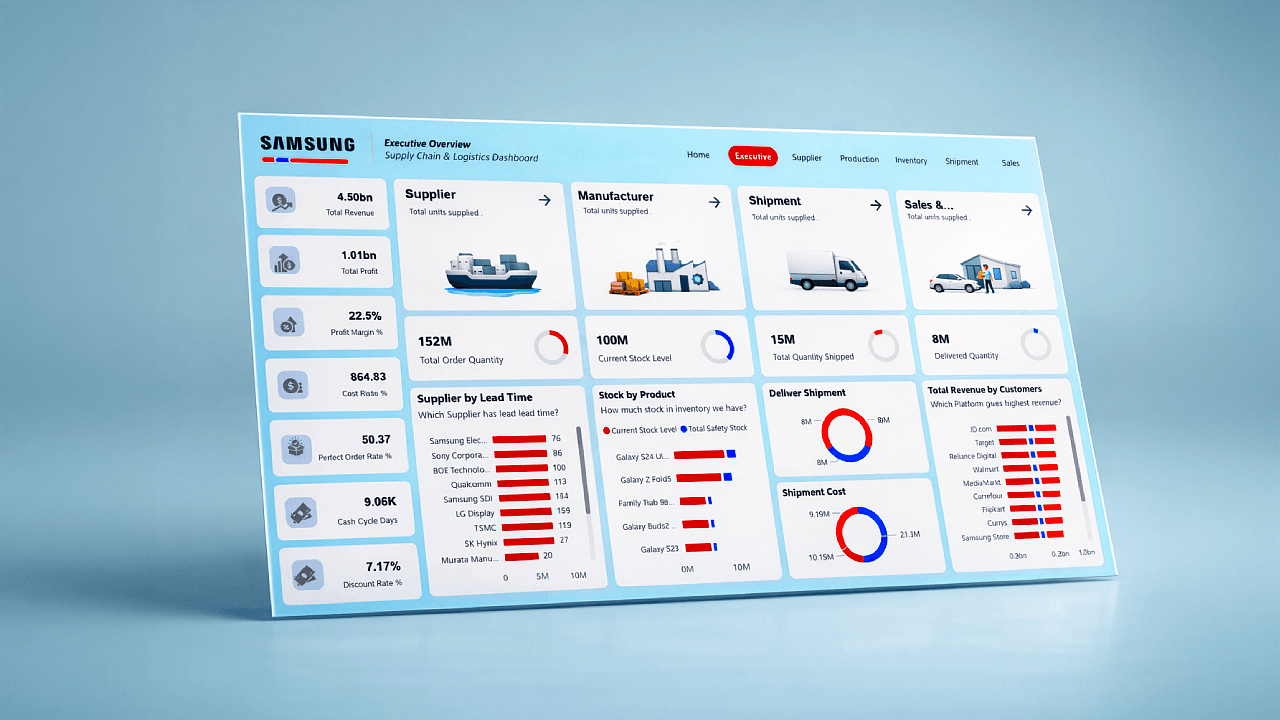
Portfolio Projects That Get You Hired
Recruiters spend 30 seconds reviewing portfolios. Make yours unskippable with these 5 projects that demonstrate end-to-end skills.
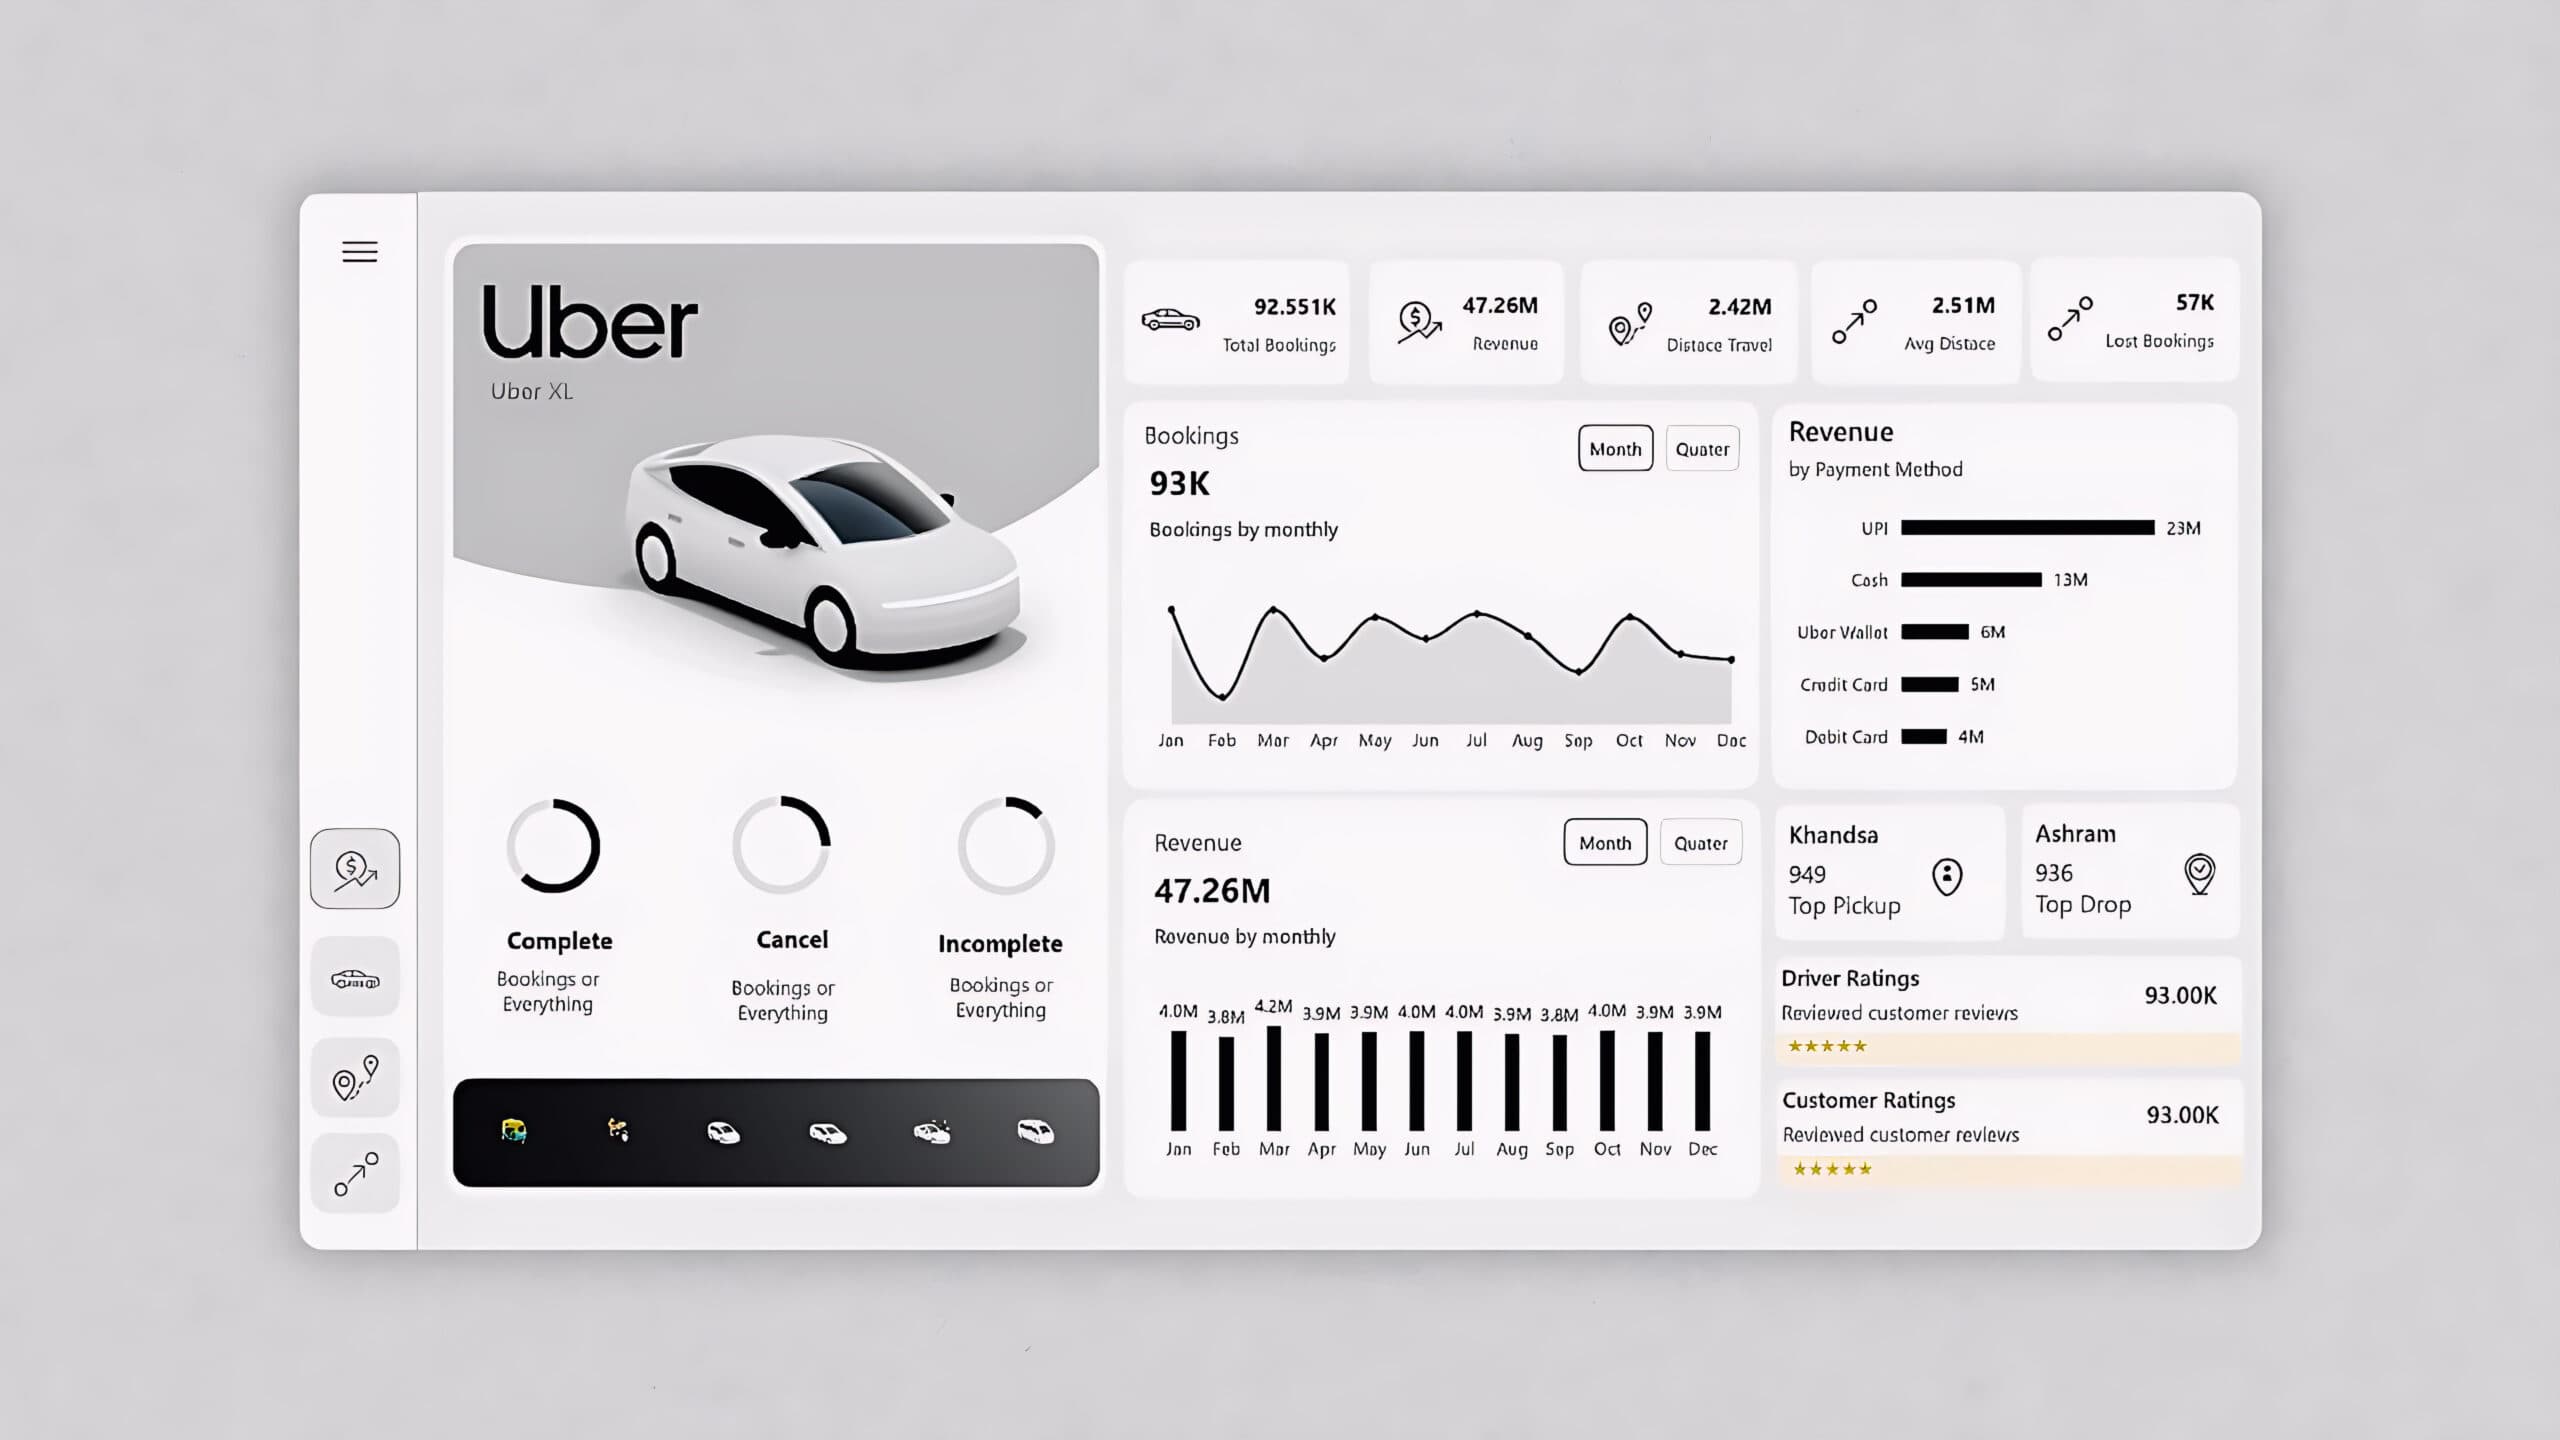
Project 1: Executive KPI Dashboard
Sales revenue, growth rates, customer acquisition cost, churn rate, pipeline health. Use SQL to extract, Power BI for interactive visuals, DAX for advanced metrics.
Project 2: Customer Churn Analysis
-- SQL: Customer segmentation and cohort analysis
WITH CustomerCohorts AS (
  SELECT
    customer_id,
    MIN(order_date) as first_order_date,
    DATE_TRUNC('month', MIN(order_date)) as cohort_month
  FROM orders
  GROUP BY 1
)
SELECT * FROM CustomerCohorts;
Project 3: Finance P&L Dashboard
Revenue vs budget, expense categories, cash flow, profitability ratios. Showcases complex DAX time intelligence and financial modeling.
Salary Expectations (2026)
| Level | US Salary | India Salary |
|---|---|---|
| Junior Analyst | $65K-$85K | ₹8-15L |
| Mid-Level Analyst | $85K-$110K | ₹15-25L |
| Senior Analyst | $110K-$140K | ₹25-40L |
Career Progression Path
- Junior Data Analyst (0-2 years): SQL, Excel, basic dashboards
- Data Analyst (2-4 years): Advanced DAX/Python, stakeholder management
- Senior Data Analyst (4-7 years): Team lead, complex projects, automation
- Analytics Manager (7-10 years): People management, strategy
- Head of Analytics / CDO (10+ years): Executive leadership
Job Search Strategy (2026)
- Optimize LinkedIn: Professional photo, SQL/Power BI skills, 3 portfolio projects linked
- Target 50 quality applications/week across LinkedIn, Indeed, company career pages
- Network with 5 data professionals/week via LinkedIn messages or industry meetups
- Practice 3 SQL interviews/week on StrataScratch or LeetCode Premium
- Record and review mock behavioral interviews using STAR method
Great data analysts don't just know tools—they solve business problems with data and communicate insights clearly to drive decisions.
Next Steps: Start Today
Download sample datasets from Kaggle, build your first sales dashboard in Power BI, solve 10 SQL problems daily, and connect with 3 data analysts on LinkedIn this week. Consistent action over 6 months beats talent without discipline.