Report developers01
A house chart style for the whole team
Build the visual once with your colours, fonts and labels, share the .pbiviz, and every report starts on-brand.
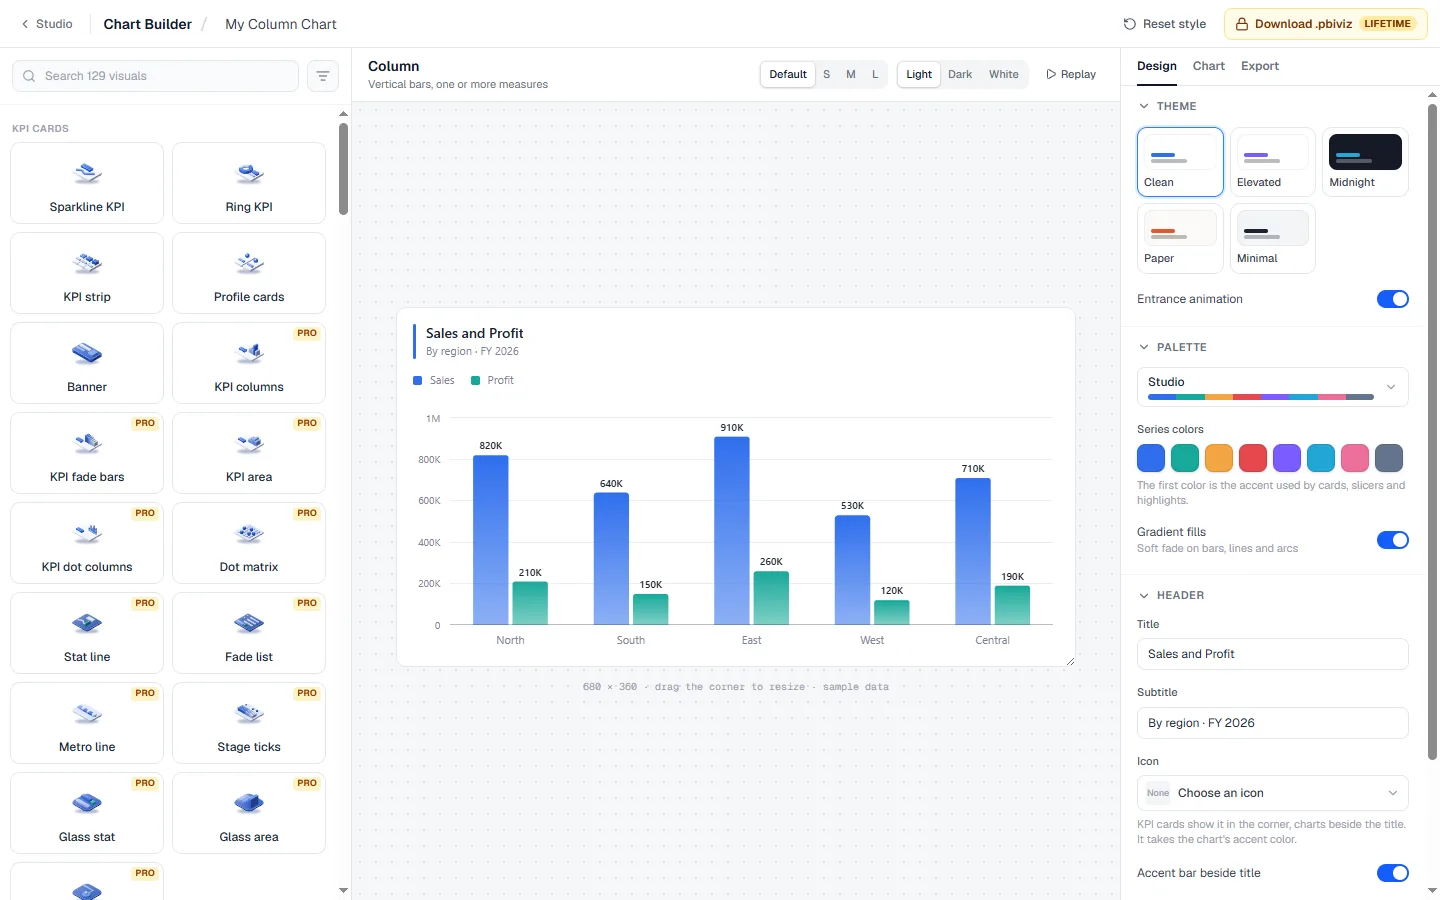
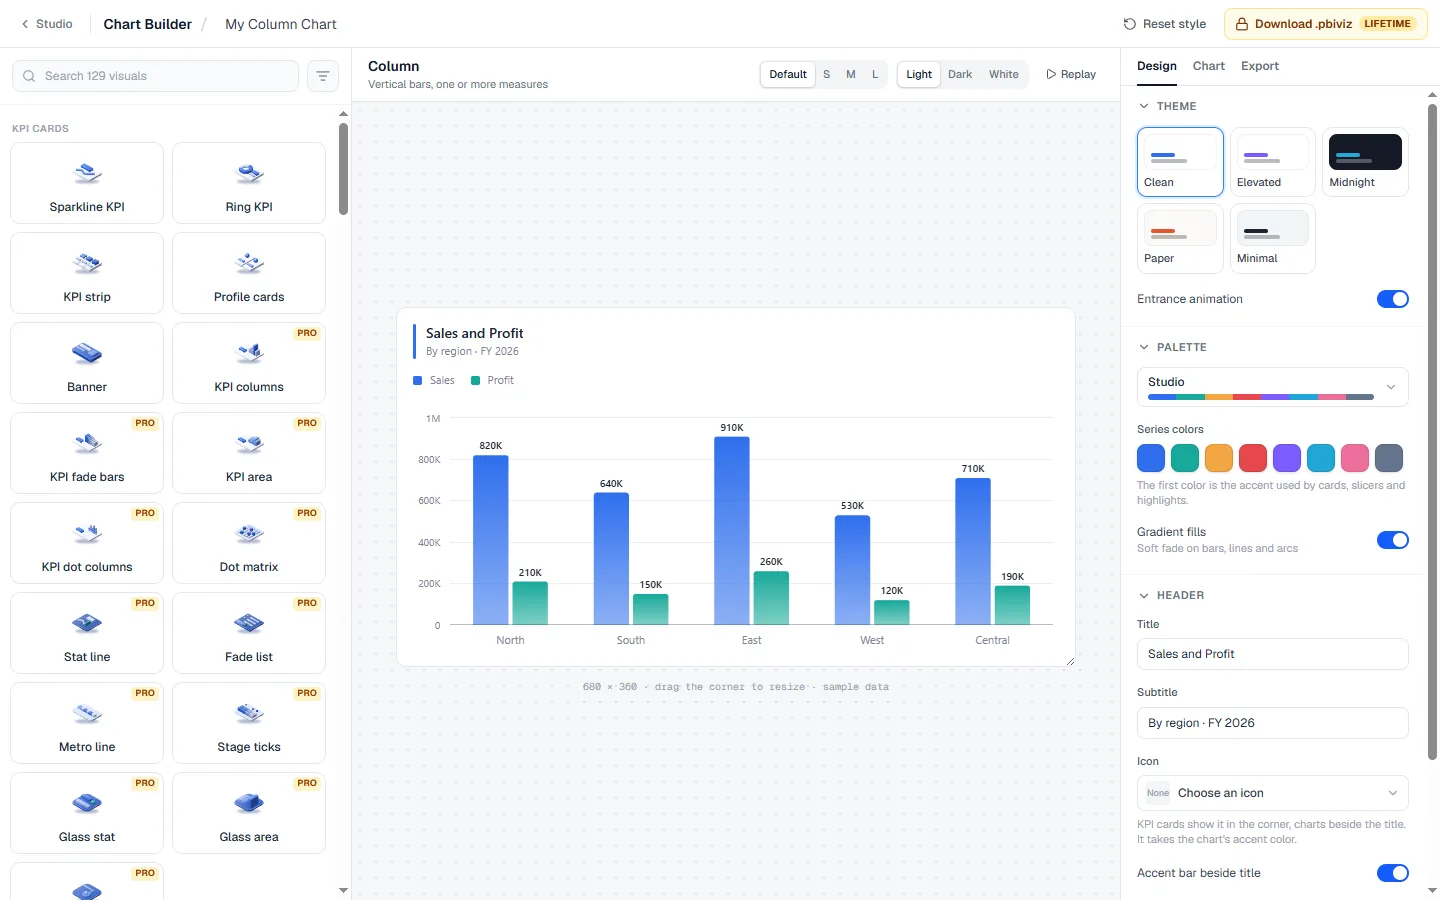
Make your own Power BI chart without touching TypeScript or the Power BI Visuals SDK. Pick a chart, style it the way your report needs, and download a .pbiviz file that you import into Power BI Desktop like any other custom visual.
The situations people open the Custom Visual Builder for, most often.
Build the visual once with your colours, fonts and labels, share the .pbiviz, and every report starts on-brand.
Gauges, KPI cards and chart types the built-in pane cannot produce, delivered as a normal custom visual.
Get a custom visual without installing Node.js or writing TypeScript. You only make the design choices.
Column, bar, line, donut, KPI cards and slicers, plus gradient, futuristic and charts Power BI does not ship.

Colors, fonts and data labels, set once and baked into the visual.
See the chart change as you edit, with sample data, before you download anything.
The download is a standard Power BI custom visual package, ready to import.
No card needed. Upgrade only for the extras listed under Plans.
Nothing to install and nothing to configure. Open the page and start.
Works on any laptop with a modern browser, at work or at home.
What you download opens in Power BI Desktop like any other file of its kind.
Use the Custom Visual Builder for free. Upgrade only for the parts below.
Billed yearly
Built-in Power BI visuals can be formatted a lot, but every new report means setting the same options again, visual by visual. A custom visual carries its look with it: drop it on a page and it already has your colors, fonts and label style.
Normally a custom visual means installing Node.js and the Power BI Visuals SDK and writing TypeScript. This builder does that part for you, so you only make design decisions.
Use it for a house style shared across a team, for a KPI card or gauge that looks the way a client asked for, or simply to get a chart that the formatting pane will not give you.
No. You choose options in the browser and the builder writes and packages the visual for you.
In the Visualizations pane, click the three dots, choose Import a visual from a file, and pick the downloaded .pbiviz. The visual then appears in the pane for that report.
Yes. After you import it, drag your fields into it like any other visual. The sample data is only used for the preview.
Building and previewing every chart is free, and 15 everyday charts download free after you sign in, with a small Power BI Studio mark. Lifetime downloads the 35 everyday charts with no mark, and Pro or the one-time Charts Bundle download all 129.
Design your own chart in the browser and download a .pbiviz for Power BI Desktop.
 Design
Glass, futuristic and brand backgrounds with card slots where your visuals sit.
 Design
5,000+ free icons for Power BI. Recolor, copy SVG or get an image URL.
 Design
Build a Power BI JSON theme with AI, ready-made palettes and a live dashboard preview.